Measuring reverberation time
How reverberation time is measured: noise, sweeps and impulses, Schroeder integration, T20, T30 and EDT, ISO 3382-1 vs 3382-2, and the usual pitfalls.
Acoustics
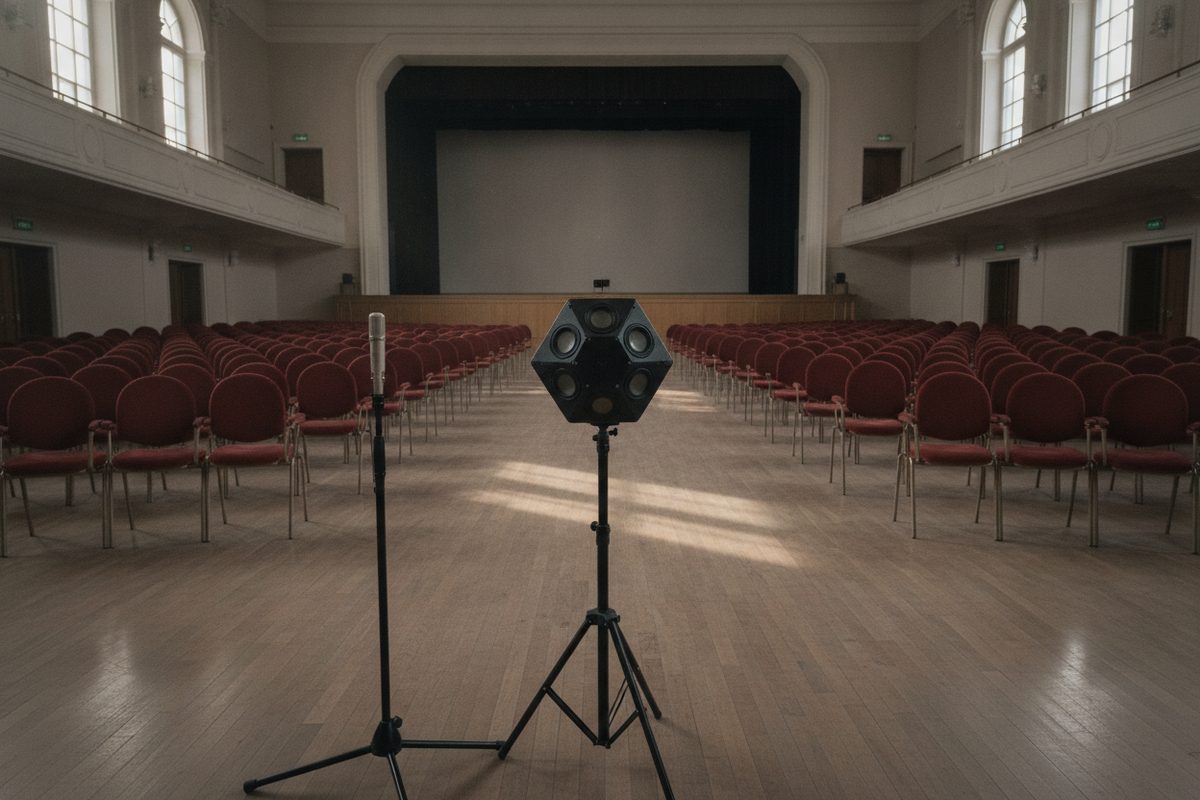
Reverberation time is the most quoted number in room acoustics and one of the easiest to get wrong. The definition is short: the time it takes for the sound pressure level in a room to fall by 60 dB after a steady source stops. A measurement involves more decisions than that sentence suggests. How is the room excited? How does a recorded signal become a decay curve? Which part of the curve is fitted, and where do the source and the microphone stand? This article takes those decisions in the order a measurement meets them.
Why nobody measures 60 dB
A fall of 60 dB is a fall to one millionth of the starting sound energy. Few measurements have that much range between the excitation and the background noise, least of all in the lowest and highest bands. Reverberation time is therefore evaluated over a shorter stretch of the decay and extrapolated. The extrapolation assumes that the decay is a straight line on a decibel scale, which is what a diffuse field produces (see random incidence).
| Quantity | Evaluation range on the decay curve | Extrapolation to 60 dB | Typical use |
|---|---|---|---|
| EDT (early decay time) | 0 dB to −10 dB | × 6 | Perceived reverberance, mainly in halls |
| T20 | −5 dB to −25 dB | × 3 | Reverberation time when the dynamic range is limited |
| T30 | −5 dB to −35 dB | × 2 | Reverberation time when the range allows it |
In each case a straight line is fitted by least squares to the chosen part of the curve, and its slope is converted into the time for a 60 dB fall. T20 and T30 skip the first 5 dB because the start of the decay is dominated by the direct sound and the first reflections, which depend on the exact positions of source and microphone. EDT uses exactly that early part on purpose. In running music, only the beginning of each decay is heard before the next notes cover it, and EDT tends to follow perceived reverberance more closely than T30 does.
For T20, the decay should begin at least 35 dB above the background noise in the band concerned; for T30, at least 45 dB. Both figures are the evaluation range plus a 10 dB margin above the noise.
Exciting the room
There are two families of method, and the ISO standards accept both.
Interrupted noise. A loudspeaker plays broadband or band-filtered random noise until the level in the room is steady, then stops, and the microphone records the decay. Because the noise is random, every decay is a little different, so several are averaged at each position. The method is intuitive and needs little processing, but it needs plenty of loudspeaker power for a good signal-to-noise ratio, and each single decay is ragged.
Impulse response methods. An impulse response, measured from one source position to one microphone position, contains everything the room does to sound travelling between those two points. Reverberation time and most other room parameters can be calculated from it. There are three common ways to obtain one.
- Impulsive sources, such as a starter pistol, a balloon burst or a wooden clapper. They are quick and need no loudspeaker. Their low-frequency energy is limited, their directivity is irregular and no two bursts are identical, so they suit a survey better than a precise measurement.
- Maximum length sequences (MLS), periodic pseudo-random binary signals whose cross-correlation with the recording yields the impulse response. MLS gives a good signal-to-noise ratio, but loudspeaker distortion and slow changes in the room, such as moving air or drifting temperature, spread through the result as artefacts.
- Exponential sine sweeps, sine tones that glide upward at a constant rate in octaves per second. After deconvolution, the loudspeaker's harmonic distortion appears as separate small responses ahead of the main one in time and can be cut away. Angelo Farina popularised the method around 2000, and it is now the usual choice in measurement software. Longer sweeps, or several sweeps averaged, raise the signal-to-noise ratio.
ISO 18233 covers these newer methods in building and room acoustics and the conditions they depend on, chiefly that the system behaves linearly and does not change during the measurement.
Schroeder backward integration
A raw impulse response, squared and plotted in decibels, is a jagged descent, and a line fitted to it is unreliable. In 1965 Manfred Schroeder showed that integrating the squared impulse response backwards in time, from its end to each moment t, gives a smooth decay curve:
E(t) = ∫ h²(τ) dτ, integrated from t to the end of the response
Plotted as 10 · lg(E(t) / E(0)), this curve equals the average of an infinite number of interrupted-noise decays at the same position. One integrated impulse response can therefore replace many repeated noise decays.
The integration needs care at its end. Every recording finishes in background noise, and integrating noise adds energy that does not belong to the decay. The late part of the curve bends upward and T30 comes out too long. The usual remedies are to cut the impulse response where it meets the noise floor and compensate for the energy lost by the cut, or to subtract an estimate of the noise before integrating. Iterative procedures for finding the cut-off point, such as the one published by Lundeby and colleagues in the 1990s, are built into much of the software in use.
ISO 3382-1 and ISO 3382-2
The ISO 3382 series has three parts. Part 3 deals with open-plan offices and is covered under speech in open-plan rooms. The other two divide rooms by purpose.
ISO 3382-1 covers performance spaces: concert halls, theatres, opera houses and other rooms for music and speech performance. Besides reverberation time it defines parameters for how a room sounds to an audience, among them early decay time, clarity C80, definition D50, centre time, sound strength G and measures of lateral energy. It calls for an omnidirectional source with limited deviation from uniform radiation, source positions where performers would be, and microphones spread over the audience area at the ear height of a seated listener, 1.2 m above the floor. The minimum number of microphone positions grows with the size of the audience, and the report must state whether the room was occupied.
ISO 3382-2 covers reverberation time in ordinary rooms such as classrooms, offices, homes, workshops and corridors. It defines three grades of measurement: survey, engineering and precision. They differ in the number of source and microphone positions, the number of decays per position with interrupted noise, and the frequency range. A survey can be made with as few as two source-microphone combinations, while the higher grades require many more. Part 2 also gives a check on the shape of the decay: when T20 and T30 differ markedly, the decay is curved and a single reverberation time describes it poorly.
For music rooms, the Part 1 parameters usually say more than reverberation time alone. The article on recording rooms explains clarity and definition in plain language.
Pitfalls
Background noise. Ventilation, traffic and computers limit the usable decay range. Measure the background noise in each band before starting. Where the range for T30 is missing in a band, report T20 there and say so.
Positions too close to the source or to surfaces. Near the source the direct sound dominates and the early decay looks too fast. ISO 3382 sets a minimum source-to-microphone distance:
dmin = 2 · √(V / (c · T))
For a room of 200 m³ with T = 1 s, dmin ≈ 2 · √(200 / 343) ≈ 1.5 m. Microphones also need to be kept away from walls and from each other. A microphone in a corner picks up a local build-up of pressure that is not typical of the room.
One position only. A single source-microphone combination gives a result for that combination. Reverberation time becomes a property of the room only after averaging over several positions, and the spread between positions is worth reporting alongside the mean.
Low frequencies. Below the Schroeder frequency the sound field consists of separate modes. In a small room the decays at 63 Hz and 125 Hz are often curved, beating or strongly position-dependent, and the scatter between positions is large. More positions help, and a single value for these bands deserves caution.
Filters. Octave and one-third-octave filters ring for a while after the signal stops, longest in the low bands. In a very dead room the filter's own decay can approach the room's and bias the result towards longer times. Some software filters the time-reversed impulse response to reduce this.
Directional loudspeakers. An ordinary loudspeaker beams high frequencies forward, so the early decay changes with the way it is pointed. The standards specify an omnidirectional source, usually a dodecahedron of twelve drivers.
The state of the room. Reverberation time changes with people, furniture, open doors and curtains, and at high frequencies with temperature and humidity, which govern air absorption. Record all of these. An occupied hall usually has a shorter reverberation time than the same hall empty, since people and clothing absorb sound, mainly in the middle and upper bands.
Reading a result
A useful report states the excitation method, the evaluation range (T20 or T30), the frequency bands, the number and positions of sources and microphones, and the condition of the room. The usual range is the octave bands from 125 Hz to 4 kHz, or the one-third-octave bands from 100 Hz to 5 kHz, and rooms for music are often measured at 63 Hz as well. A target value is meaningful only with the band it applies to: a room can meet a mid-frequency target and still ring at 125 Hz. Sabine's formula, which links the result to the absorption in the room, is set out in the article on random incidence, and the meaning of absorption data in normal and random incidence.
The same questions apply to the rooms in which the music documented in this archive was made. Several release pages mark a recording as live, among them RA 001 at the MUSEUM Bochum in 1992 and RA 026 at LOFT in Cologne in 1999. The pages do not describe the rooms, and no reverberation times for them are known here. The venue index and the recording chronology record only where and when the music was played.
Key terms
- Reverberation time (T): the time for the sound level to fall by 60 dB after the source stops, normally extrapolated from a shorter range.
- Impulse response: the response of a room, between one source position and one receiver position, to an ideal impulse; most room parameters derive from it.
- Schroeder backward integration: integration of the squared impulse response from its end backwards, giving a smooth decay curve.
- T20 and T30: reverberation time evaluated from −5 to −25 dB or from −5 to −35 dB of the decay curve.
- EDT (early decay time): decay time over the first 10 dB, multiplied by six; closely related to perceived reverberance.
- Exponential sine sweep: a test signal whose deconvolution yields an impulse response with the loudspeaker's distortion separated in time.