Normal and random incidence: two ways to measure absorption
Impedance tube (ISO 10534-2) vs reverberation room: why lab absorption can exceed 1, edge effect, αw and absorption classes (ISO 11654), NRC and SAA.
Acoustics
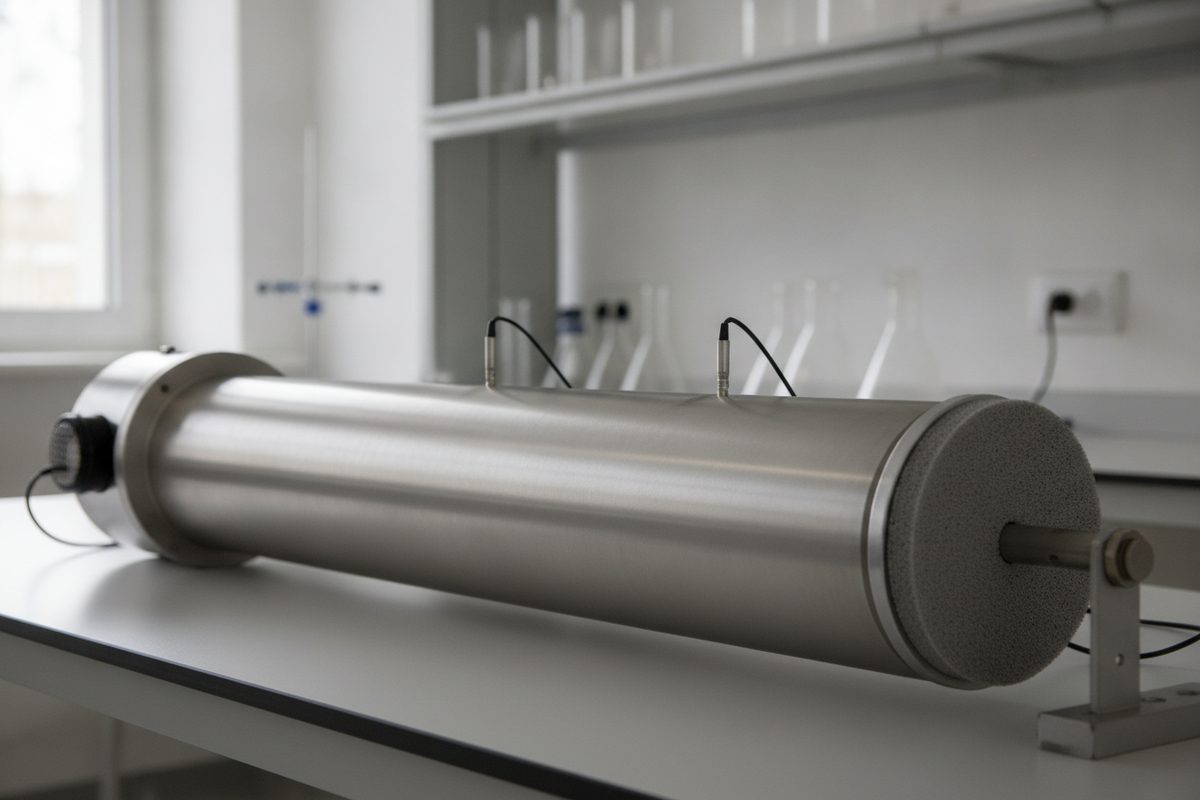
Two absorption coefficients for the same material can differ widely and both be correct. One comes from a tube a few centimetres across, in which sound strikes a small disc of material head-on. The other comes from a reverberation room of a couple of hundred cubic metres, in which sound reaches a sample of about ten square metres from every direction. They answer different questions, and mixing them up is one of the commonest mistakes in reading acoustic data.
The impedance tube (ISO 10534-2)
An impedance tube, sometimes called a Kundt's tube after the older standing-wave apparatus, is a rigid straight tube with a loudspeaker at one end and the sample at the other, backed by a rigid plate or by a defined air space. Sound travels along the tube as a plane wave, meets the sample at normal incidence, perpendicular to its surface, and is partly reflected.
ISO 10534 has two parts. Part 1 describes the standing-wave ratio method, in which a probe microphone is moved along the tube to find the pressure maxima and minima. Part 2 describes the transfer-function method, now the usual one. Two fixed microphones in the tube wall record a broadband signal, and the transfer function between them gives the complex reflection factor r of the sample. The normal-incidence absorption coefficient follows as
α0 = 1 − |r|²
The same data give the surface impedance of the sample, a complex quantity that is valuable for modelling and for calculating behaviour at other angles of incidence.
The tube's dimensions set its frequency range. Only plane waves may travel along it, which holds up to the frequency at which the first cross-mode appears. For a circular tube of diameter d this upper limit is roughly fmax ≈ 0.58 · c / d, so a tube 100 mm wide stops a little below 2 kHz. Laboratories therefore often use a wide tube for low frequencies and a narrow one for high frequencies. The microphone spacing sets further limits at both ends of the range.
The tube is quick, needs only small samples and suits the development of porous materials, comparisons between batches and the measurement of input data for prediction software. Its limits are clear. The sample is small and its edges are held by the tube wall, which changes the behaviour of anything that can flex or vibrate. Perforated panels with widely spaced holes, membranes, large resonators, diffusers, curtains and furniture cannot be represented by a disc a few centimetres across. And all the sound arrives from one direction.
The reverberation room (ISO 354)
The reverberation-room method, described in the article on random incidence, measures how much a large sample shortens the reverberation time of a highly diffuse room. Its result, the Sabine absorption coefficient αs, is meant to represent the random-incidence behaviour of the material in a realistic mounting. It is the basis of most product data and of the single-number ratings below. The decay measurements themselves follow the methods in measuring reverberation time.
Why the two numbers differ
Angle of incidence. α0 describes one angle; a random-incidence value averages over all of them. For many porous materials, absorption rises as the angle becomes more oblique, up to a point, and then falls again towards grazing incidence. Depending on the material and the frequency, the average can come out above or below the normal-incidence value, so there is no fixed conversion factor between the two.
Mounting. The same 50 mm layer behaves differently glued to concrete, hung in front of a deep air gap or clamped in a tube. Every test reports its mounting, and a coefficient quoted without one is incomplete.
Sideways propagation. In a tube, sound can only travel straight into the sample. In a large panel, sound inside a porous layer or in the air space behind it can also travel sideways, and the panel as a whole may vibrate. Materials whose behaviour depends on these effects are measured realistically only at full size.
Sample size and the edge effect. A sample of finite size absorbs more than its area alone would suggest. Sound diffracts at the edges, energy flows into the sample from a zone around it, and the effective absorbing area is larger than the geometric one. The effect is strongest where the wavelength is comparable to the sample's dimensions, mainly at low and middle frequencies, and larger for small or narrow samples, whose perimeter is long relative to their area. ISO 354 fixes the sample area and asks for a near-square shape, so that the edge effect is similar from one test to the next, and it asks for the sides of the specimen to be enclosed by a reflecting frame, so that the edges themselves add no absorbing surface.
Why a laboratory value can exceed 1
A coefficient above 1 looks impossible, since no surface can absorb more energy than falls on it. Yet a reverberation-room αs of 1.05 or 1.10 is common for thick porous absorbers, and it is no measuring error. αs is the added equivalent absorption area divided by the geometric area of the sample, and three things can push that ratio past 1:
- the edge effect, which makes the effective area larger than the geometric one;
- the sound field near a large absorber, which is less than fully diffuse, with energy flowing towards the sample from the rest of the room;
- Sabine's formula, used in the calculation, which grows less accurate as a room becomes more absorbent, and the room is far more absorbent with the sample in it than without.
A value above 1 therefore means that the sample, in that size and mounting, removed more sound than a perfect absorber of the same geometric area would have under ideal assumptions. Designers usually cap such values at 1 in calculations, or use the practical coefficient described next, which is capped by definition.
Single numbers from ISO 11654
ISO 11654 turns one-third-octave αs values into ratings for use in buildings.
Practical absorption coefficient αp. For each octave band from 125 Hz to 4 kHz, the mean of the three one-third-octave αs values within it, rounded in steps of 0.05 and capped at 1.00.
Weighted absorption coefficient αw. A reference curve is shifted in steps of 0.05 towards the αp values from 250 Hz to 4 kHz until the sum of the unfavourable deviations, the amounts by which αp falls below the curve, is no more than 0.10. αw is the value of the shifted curve at 500 Hz. Where αp exceeds the shifted curve by 0.25 or more, a shape indicator is added: L for 250 Hz, M for 500 or 1000 Hz, H for 2000 or 4000 Hz. An αw of 0.60(H), for instance, marks a material that absorbs high frequencies markedly better than its single number suggests.
Absorption class. αw grouped into five classes, A to E, with A for the most absorbent materials. Values of αw below 0.15 are not classified.
NRC and SAA (ASTM C423)
In North America the reverberation-room test follows ASTM C423, which applies the same principle as ISO 354 with its own room and specimen requirements and with standard mountings described in ASTM E795. Two single numbers are derived from it.
NRC (noise reduction coefficient). The average of the coefficients at 250, 500, 1000 and 2000 Hz, rounded to the nearest 0.05.
SAA (sound absorption average). The average of the twelve one-third-octave coefficients from 200 Hz to 2500 Hz, rounded to the nearest 0.01.
The ratings side by side
| Rating | Standard | Bands used | Steps and limits |
|---|---|---|---|
| αp | ISO 11654 | Each octave from 125 Hz to 4 kHz, from three one-third-octave values | Steps of 0.05, capped at 1.00 |
| αw | ISO 11654 | Octaves from 250 Hz to 4 kHz, fitted to a reference curve | Steps of 0.05, read at 500 Hz, shape indicators L, M, H |
| Class A–E | ISO 11654 | Derived from αw | A 0.90–1.00, B 0.80–0.85, C 0.60–0.75, D 0.30–0.55, E 0.15–0.25 |
| NRC | ASTM C423 | Octaves at 250, 500, 1000 and 2000 Hz | Nearest 0.05 |
| SAA | ASTM C423 | Twelve one-third-octave bands, 200 Hz to 2500 Hz | Nearest 0.01 |
None of the single-figure ratings, αw, the class, NRC or SAA, uses the 125 Hz octave or anything below it. A thin porous panel and a deep panel with an air gap behind it can share an αw and still differ greatly at 125 Hz. In rooms for music, where low-frequency build-up is often the main problem, that difference matters more than the rating. The article on recording rooms explains why the low end behaves differently from the rest of the range.
Reading a data sheet
A few questions sort most absorption data:
- Which method? A tube value, α0, and a reverberation-room value, αs, are not interchangeable.
- Which mounting? Note the thickness, the air gap and any facing, and compare like with like.
- Which bands? Look at the whole curve, especially at 125 Hz and 250 Hz, before the single number.
- Which kind of sample? For objects such as seats, screens and baffles, the meaningful result is an absorption area per object, in m².
- Values above 1? They are legitimate as measured, but cap them when using Sabine's formula to design a room.
Absorption controls how sound behaves inside a room. It does little to stop sound passing from one room to the next, which is a matter of insulation, covered in enclosures and insulation. How ceiling absorption affects privacy between desks is the subject of speech in open-plan rooms. The section index lists all six articles.
Key terms
- Normal incidence: sound striking a surface perpendicularly, as in an impedance tube.
- Normal-incidence absorption coefficient (α0): absorption measured in an impedance tube to ISO 10534, calculated as 1 − |r|².
- Edge effect: the additional absorption of a finite sample caused by diffraction at its edges.
- Practical absorption coefficient (αp): the ISO 11654 octave-band value, rounded in steps of 0.05 and capped at 1.00.
- Weighted absorption coefficient (αw): the ISO 11654 single number, read at 500 Hz from a reference curve shifted to fit the measured values.
- NRC: the ASTM C423 average of the coefficients at 250, 500, 1000 and 2000 Hz, rounded to the nearest 0.05.